One of the best predictors of whether a person will become an abusive parent is if he or she was abused as a child. On the face of it, this is puzzling. Certainly, as children, these people did not say to themselves, “This is how I want to treat my kids.” To the contrary, our guess is that they said to themselves, “I am definitely not going to treat my children the way I have been treated.” And yet they did; they did not escape the influence of that terrible role model.
This got us to wondering whether there might be a leadership analogy to this sad phenomenon. That is, we wondered, “Do people who work for terrible leaders turn out to be terrible leaders themselves?”
In our research we’ve demonstrated that a great leader can have powerfully positive effects on an organization: decreasing turnover of team members and greatly increasing customer satisfaction, profitability, employee engagement, sales revenue, and even workplace safety—-virtually every business outcome that’s measureable. In those studies, we’ve looked primarily at the relationship between individual leaders and their groups of direct reports. Recently, we’ve become fascinated by the question, “How much impact does a great or poor leader have at the next level down—on those who work for those direct reports?”
When we ask individuals about how their bosses influence their own leadership styles, they often respond that they are their own persons. Whether working for a great boss or a nightmare one, they feel that they are in control of themselves and the situation. If there’s a bad boss above, they serve as a buffer.
When we look at three levels of our 360 evaluations of the leadership effectiveness, correlating the scores of executives and their direct reports with those of the teams of those direct reports, we find some truth in this: we do see some leaders performing substantially better than their bosses. But we also see influences, good and bad, cascading down the line.
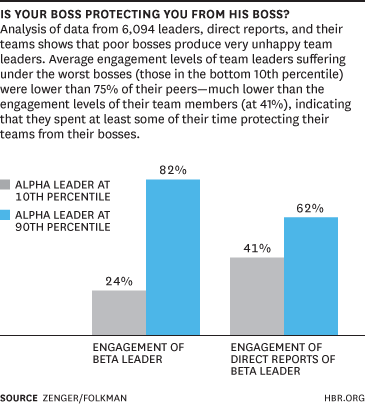
For this study we matched up data from 6,094 leaders (whom we will arbitrarily label “alpha leaders”) with their direct reports who were also leaders (whom we’ll call “beta leaders”) and the beta leaders’ direct reports. We assessed the overall effectiveness of each leader and the engagement level of that person’s direct reports.
First off, examining the best (top 10%) and worst (bottom 10%) of the alpha leaders (as assessed by the beta leaders who work for them), we were able see a substantial difference in the engagement levels of the beta leaders (as assessed by their direct reports). Not surprisingly, beta leaders who worked for the worst alpha leaders suffered; their engagement was abysmal, averaging in the 24th percentile. Meanwhile, the average engagement level of the betas who worked for the best alphas was at the robust 82nd percentile. This mirrors our global study of these same variables with over 30,000 leaders.
One level down, the effect is similar, but not as strong in either direction: Engagement levels of teams headed by beta bosses laboring under horrible alphas average in the 39th percentile while those of teams headed by betas working for the best alphas are only at 61th percentile, considerably lower than their bosses.
If alpha leaders had no effect on beta leaders, we’d have expected the average beta leader engagement scores to be at the 50th percentile, since with this large a sample, the good and bad leaders would balance each other out. So clearly, it’s not easy to be a buffer: a bad boss is a drag on a leader’s effectiveness. In fact, teams rated the leadership effectiveness of the beta leaders who worked for the worst alphas 11 percentile points below average, while teams rated the betas working for the best alphas 11 percentile points above average. The symmetry here is striking.
Still, our data show that it is possible to work for one of the worst leaders and yet be rated as one of the best yourself. While 14% of beta leaders working for the worst alphas fell themselves in the bottom 10% in leadership effectiveness, 7% of those harried betas were rated by their direct reports as among the top 10% of leaders. At the same time, fully 24% of beta leaders working for the best alphas were themselves also in that top group, while only 7% of them fell in the bottom 10%.
What are we to make of this? First, we’d argue that our data show, happily, that great leaders do more good than poor leaders do harm. And to those who say their destiny is in their own hands, we’d say they could be right — the cycle of poor leadership can be broken.
On the other hand, we’d argue that good leaders are expending a lot of energy they could be using more productively when they have to manage and buffer a bad boss. This should be blindingly obvious. And yet, so often in our practice senior leaders ask us to “fix” the leaders below them. The reality is our job would be much easier if the leaders at the top were as highly committed to fixing themselves first.


